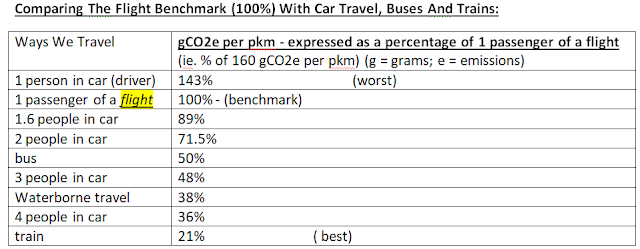
Comparing Emissions In Ways We Travel
About the Benchmark: A passenger flight is 160 gCO2e per pkm. This means that flying is better than taking a car only if you’re the only person in the car (see benchmark in table above.)
Note: Contrail Pollutants Contribute Twice the Impact of Airline CO2 Emissions (see below)
See calculations below
The various “people in car” percentages in the above table are first extrapolated from the data below as they compare with “implied car occupancy rate: 1.6 [people in a car].” Then all percentages in the above table are extrapolated from the below data as they compare with the flight benchmark.
Figure 1: Average GHG emissions by motorised mode of passenger transport, EU-27, 2014-2018
Source: Fraunhofer ISI and CE Delft, 2020
*Notes: pkm = passenger kilometre; implied car occupancy rate: 1.6
Source – European Environment
Agency. See link. See PDF named “Rail and waterborne — best for low-carbon motorised transport."
Cars: The number of people in the car affects the emissions per person:
Bar graph, Notes: pkm = passenger kilometre; implied car occupancy rate: 1.6 passenger(s).
As the car occupancy rate rises, the Carbon Emissions (gCO2e) per pkm drops. This is an inversely proportional calculation (not a directly proportional calculation). See “Math is Fun” explanation at this link.
Quote from above Math web page:
This: y is inversely proportional to x
Is the same thing as: y is directly proportional to 1/x
Which can be written: y = k/x
The example from Math Is Fun
It is an Inverse Proportion:
- As the number of people goes up, the painting time goes down.
- As the number of people goes down, the painting time goes up.
We can use: t = k/n
Where:
- t = number of hours
- k = constant of proportionality
- n = number of people
The example from Our Car Passenger Table
It is an Inverse Proportion:
- As the number of occupants of the car goes up, the emissions per person goes down.
- As the number of occupants of the car down, the emissions per person goes up.
We can use:
grams of CO2 per person kilometer = 228.8 / number of occupants of the car (for calculation see table below)
Where:
- t = grams of CO2 per person kilometer
- k = 228.8 = constant of proportionality
- n = number of occupants of the car
Side note: This is European data. Cars are smaller in Europe than in N. America. (Are trains also smaller?)
Also, a train trip across Europe is shorter than a train trip across Canada or the US. This likely implies less use of overnight sleeping quarters (private cabins, private bathrooms, etc.) which are a heavier apparatus to haul.
"Contrail Pollutants Contribute Twice the Impact of Airline CO2 Emissions, Study Finds"
Quote from article from The Energy Mix: "A [2020] report from the European Union Aviation Safety Agency concludes that emissions of black carbon, nitrous oxide, soot, and water vapour were responsible for two-thirds of the total climate impact of the aviation industry in 2018—twice that of its CO2 emissions."
That 2020 report was corroborated by a other subsequent reports: See link: "What share of global CO₂ emissions come from aviation?"


Comments
Post a Comment