Comparing Emissions In Ways We Travel
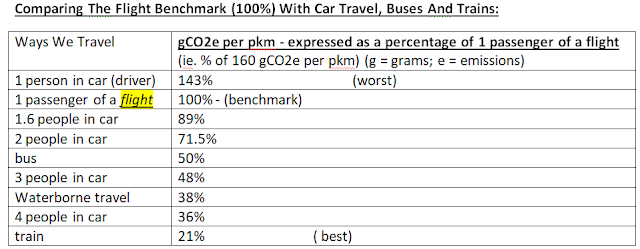
About the Benchmark: A passenger flight is 160 gCO2e per pkm. This means that flying is better than taking a car only if you’re the only person in the car (see benchmark in table above.) Note: Contrail Pollutants Contribute Twice the Impact of Airline CO2 Emissions (see below) See calculations below The various “people in car” percentages in the above table are first extrapolated from the data below as they compare with “ implied car occupancy rate: 1.6 [people in a car] .” Then all percentages in the above table are extrapolated from the below data as they compare with the flight benchmark. Figure 1: Average GHG emissions by motorised mode of passenger transport, EU-27, 2014-2018 Source : Fraunhofer ISI and CE Delft, 2020 *Notes : pkm = passenger kilometre; implied car occupancy rate: 1.6 Source – European Environment Agency. See link. See PDF named “ Rail and waterborne — best for low-carbon motorised transport." Cars: The number of people in the car affect...